This post expands the ideas from the Community Service Hour Polymarket bot (ep. 142) about building a prediction-market trading bot on your laptop. We walk through each slide and explain the practical architecture, the tooling choices, and the discipline required to properly study and implement a machine-learning quant desk for running market bets against Polymarket.
The main point is that this domain is a very good place to learn how modern data systems, backtesting discipline, and operational engineering actually work together. And now is a unique time to get started, because the entire history of Polymarket trading data is still small enough to fit on your laptop. Soon, this dataset, and the analysis will no longer be feasible on basic hardware most people have.
Thank you to AI Philly (Meetup) for setting up this event!
Why this is interesting now
Prediction markets are interesting because intersect finance, machine learning and software engineering.
- The Polymarket historical trades dataset is small enough (1 TB) that you can fit it on your laptop computer and analyze it. (But not for long!)
- You can understand it at a high level, and it’s simple enough that LLM can implement a trading bot for you.
- Running a trading bot can make you real money (if you are eligible to operate one).
You can also rescrape and build it yourself with the provided code.
The source code for this blog post/presentation is published on GitHub and the scraped dataset is published on Hugging Face.
The talk starts with the basic question: what is a prediction market and how does it actually get represented on chain?
Outcome tokens
The fundamental approach is that each outcome is expressed as a yes/no question. The system provides two tokens that are complementary. One token represents the outcome happening. The other represents it not happening. For example:
- Will Vance be the 2028 Republican nominee for US president? –> YES
- Will Vance be the 2028 Republican nominee for US president? –> NO
- Will Rubio be the 2028 Republican nominee for US president? –> YES
- Will Rubio be the 2028 Republican nominee for US presiden? –> NO
- …
Complementary usually means one pays out 100% and the other 0%. Other exceptional splits are possible.
Each pair of yes/no tokens is complementary. And the total payout for each combination of YES + NO is always complementary. And across multiple choices like this one, other complimentarity exists. For example, it is not feasible for both Vance and Rubio to be the Republican nominee.
Each market order ends up touching one of these YES/NO tokens. Let’s trace that order back from the original order intent.
How an order reaches the blockchain
An order starts as an intention. You want to bet on something, say a World Cup match, and that intention has to travel all the way onto a public blockchain before it counts. Let’s see each step that happens: when the decision is made, when it clears, and when it becomes permanent.
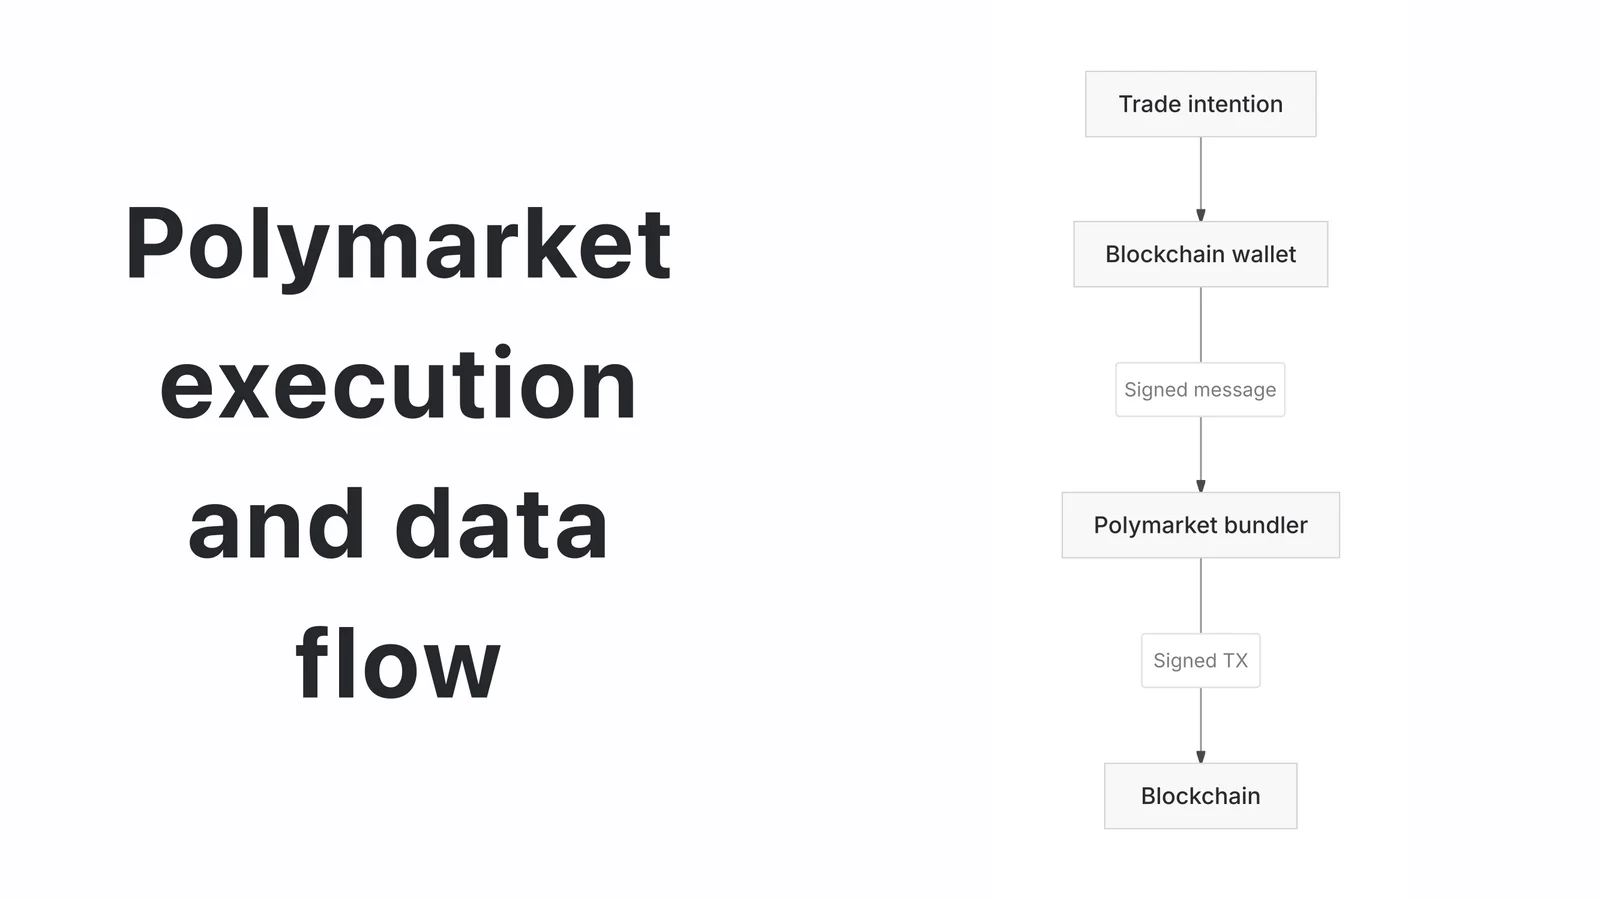
Knowing precisely how trade data lives on the blockchain was even the subject of a lawsuit involving a friend of the show. Show up IRL to ask for details.
Under Polymarket there are two ways to clear a trade. You can sign everything yourself, which almost nobody does, or you can use the hosted wallet, which almost everybody does. Either way you are signing a message in the Ethereum sense, not a transaction. That message is relayed to a bundler, physically routed through a Polymarket relayer server near the UK, which pays the gas and plays your order onto the Polygon network.
Polygon produces a block about every two seconds. Once your order lands in a block it is locked, irrevocable and written to the ledger. That final on-chain record is the thing we care about: every closed trade is there, showing which tokens moved from one account to another and the money that moved the other way.
CLOB market mechanism
Polymarket matches orders with a central limit order book, or CLOB. If you have ever seen a level-two order book on TradingView, with stacked reds and greens, that is the same structure. As an outside observer (from the blockchain logs) you do not see the full book, you only see the price that actually cleared.
The split between a maker and a taker is important:
- If the best resting offer is at 400 and you buy it there, you are the taker. You lift liquidity off the book and you decide the exact moment of execution.
- If instead you post a bid at 375, you are the maker. Your commitment is now made, and you carry risk until someone trades against you.
Carrying that risk is exactly what is valuable to the other side.
A single taker can also sweep several makers at once. Picture resting bids at 300, 301, and 302 while the market sits at 305: one incoming sell walks down the book, taking 302 first, then 301, then 300. One shark eats three fish.
Even in an “atomic match”, the trade that closed last sets the final price, not the average of the fills.
When you later read the tape you just see prints at 302, 301, 300. But which side initiated, in which direction, and in what sequence is the information that actually matters, and all of it later becomes features for the model.
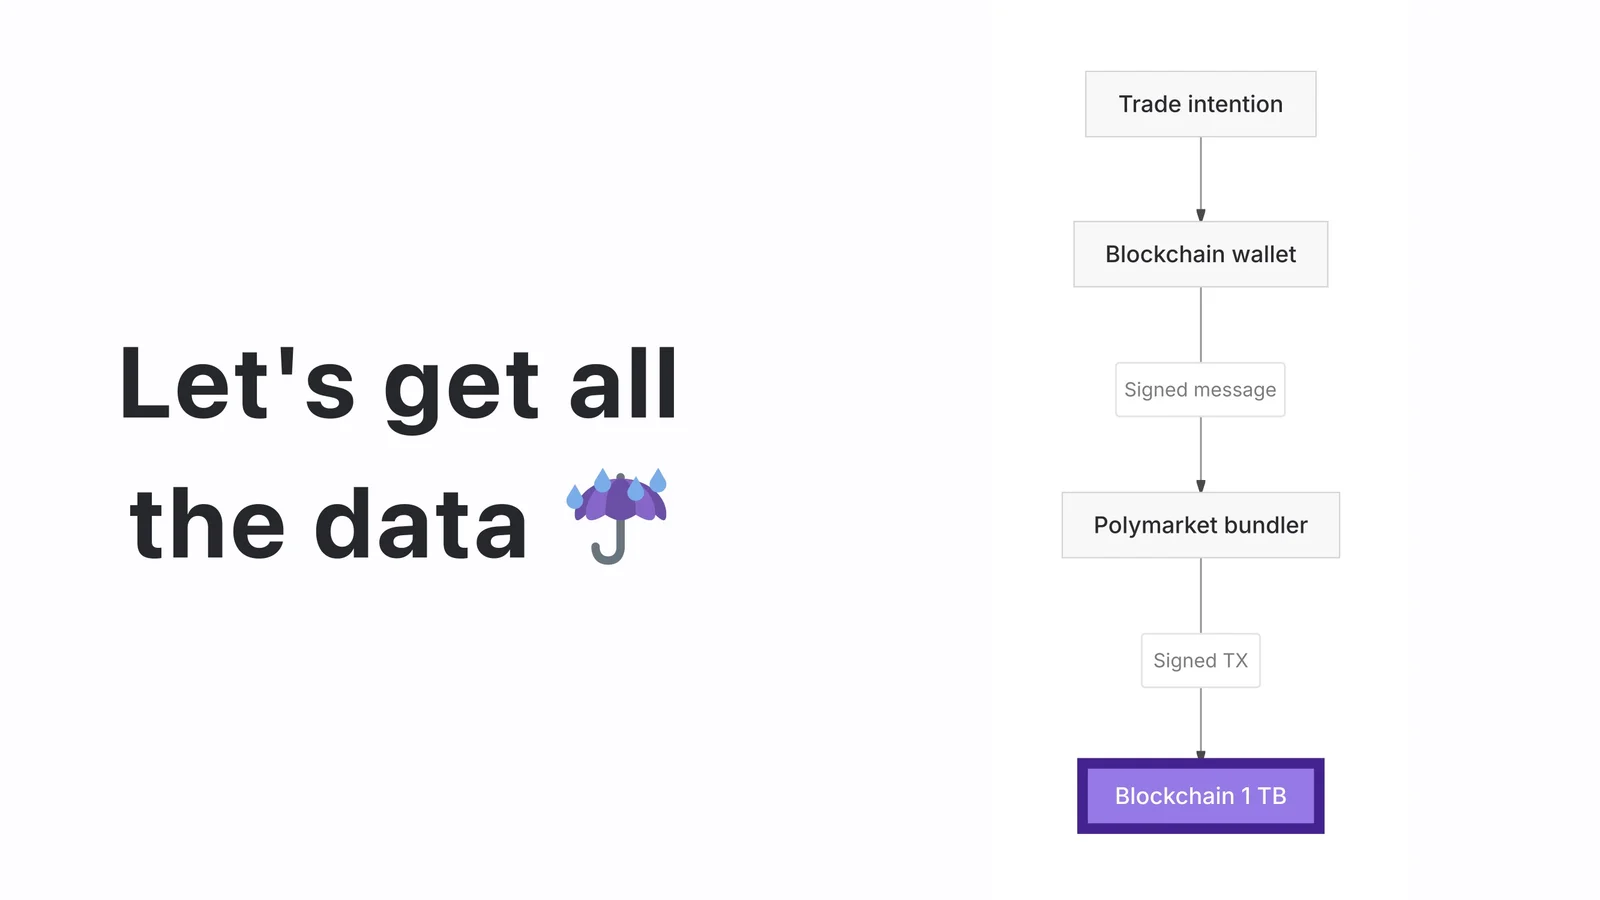
Get the data from the chain, not the API
There is a tempting shortcut. Polymarket exposes its own history through the Gamma API. The problem is trust: you would have to assume they are not hiding rows, that the historical numbers are accurate, and that today’s data is apples-to-apples with what they served in the past. It is also not published in bulk, you pull it row by row.
The alternative is to treat the blockchain itself as the source of truth. Every node that participates in the chain holds the same data, so you can query any provider and get identical, reproducible results. You can pay about $30 a month to an API provider, use a free key, or simply pull the roughly one-terabyte dataset off ourr Hugging Face dataset. It is equivalent any way you get it.
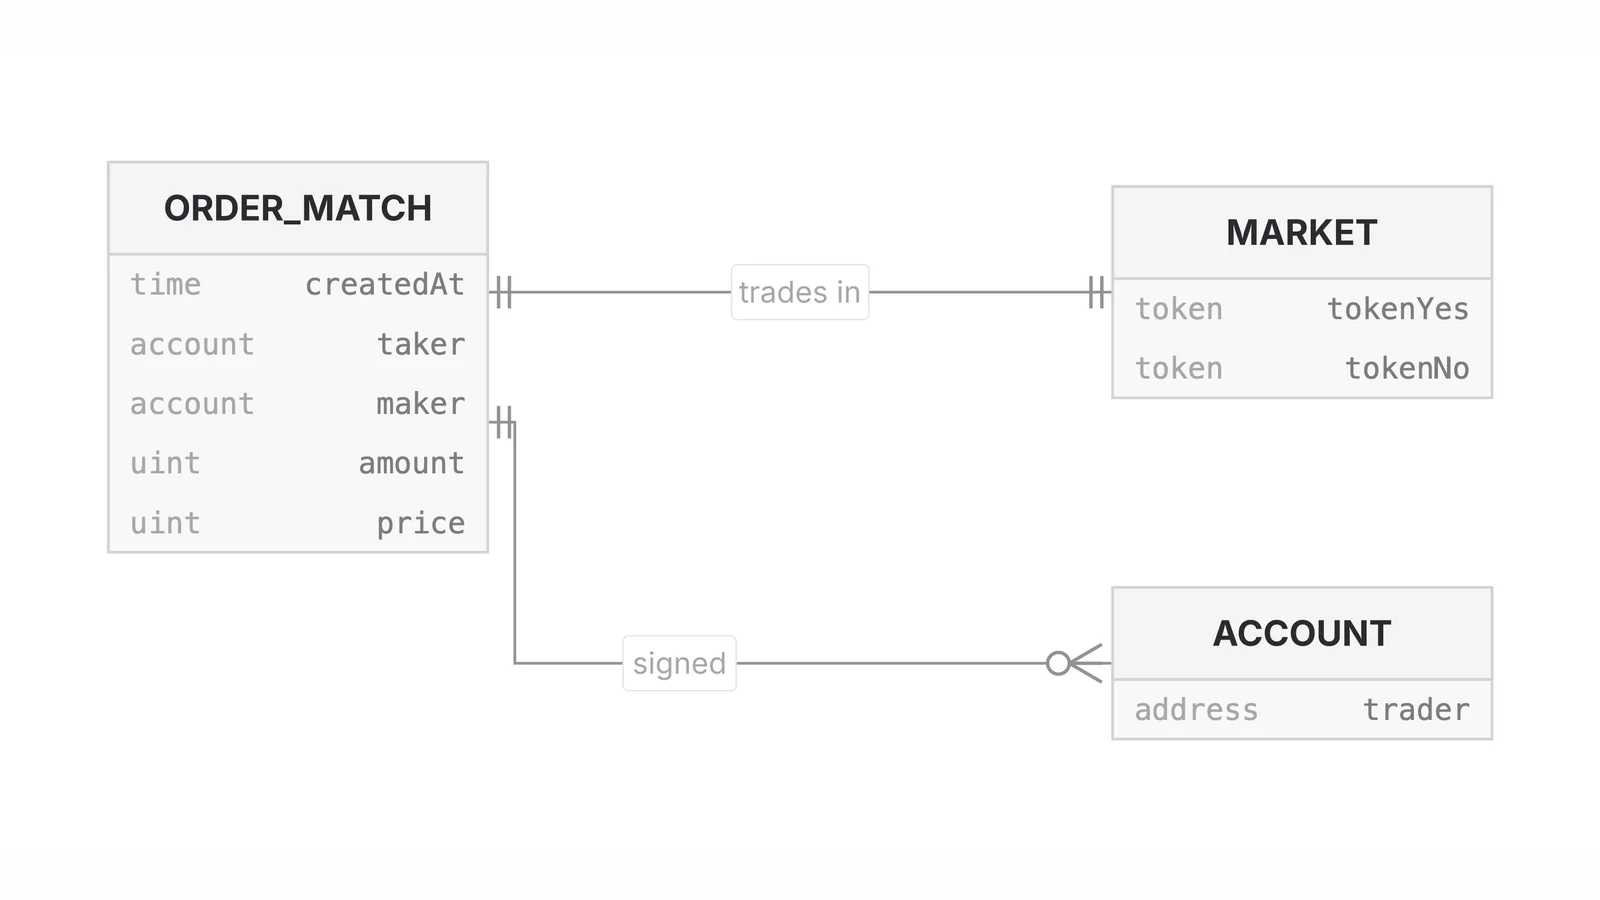
The raw data lands as around thirty tables, but let’s look at three of them now:
- A market is a specific event with a testable outcome, such as a single World Cup match, split into complementary yes/no tokens.
- Accounts are holders of risk. They may be humans or bots.
- Fills/order matches are the trades that actually happened.
These are the same techniques you would use against a real exchange like NASDAQ, just with bigger machines and fatter pipes.
Why DuckDB and Parquet, not SQLite
My first instinct was to reach for SQL and that is exactly what the project did at first: a single terabyte-sized SQLite file on disk. It worked, but it was the wrong tool. SQLite, MySQL, and Oracle are tuned for looking up one row at a time. E.g. a user logs in, fetch their name, record one action. Our questions are the opposite shape: look at every trade an account ever made across two years and summarize how far its prices sat from the market. Every query scans and transforms the full dataset.
That is a columnar, analytical workload, and it is what DuckDB is built for. DuckDB is the database, Parquet is the file format, essentially compressed CSV with some magic inside. You do not even need a server, DuckDB rips straight through Parquet files on disk and uses every core it can find.
An account-follow backtest took seven seconds (M4, 24 GB RAM, 20 cores). SQLite took 100× longer.
This is also why now is the moment. The full history still fits on a normal laptop, but as the market grows it will eventually become a ten-terabyte and hundred-terabyte problem that only serious hardware can touch.
Raw data and derived data
All of the data we use for backtesting and operations is immutable and reproducible. We separate raw data from derived data as follows:
- Raw data comes from a primary source (e.g. blockchain logs)
- Derived data can be regenerated byte-for-byte identically each time from the raw data.
Use immutable, partitioned Parquet files. Instead of one giant mutable database, a fresh partition is written on a fixed cadence, roughly every five hours, and the whole set aggregates into one logical dataset. Because each partition is immutable, you can hash every file and keep a manifest recording exactly which files existed on a given date. Later you re-check the hashes and prove nothing shifted underneath you, without cloning a terabyte disk every day.
That discipline is called provenance. When a derived feature looks wrong, you trace it straight back to the exact files and hashes it was built from. When you build a trading model, same thing. When you see a trade execution, same thing. Every calculation, model formula and trade decision can be reproducibly traced back (ultimately) to the raw data.
If you can’t do that you are not a real quant.
Feature engineering and trading theses
Features are just the columns you let the machine reason over, the same way you would lay them out in a spreadsheet, and the model minimizes a loss function against an objective you define. Use your intuitions to try different optimization models, until you find some useful trading strategy.
Let’s look at some examples.
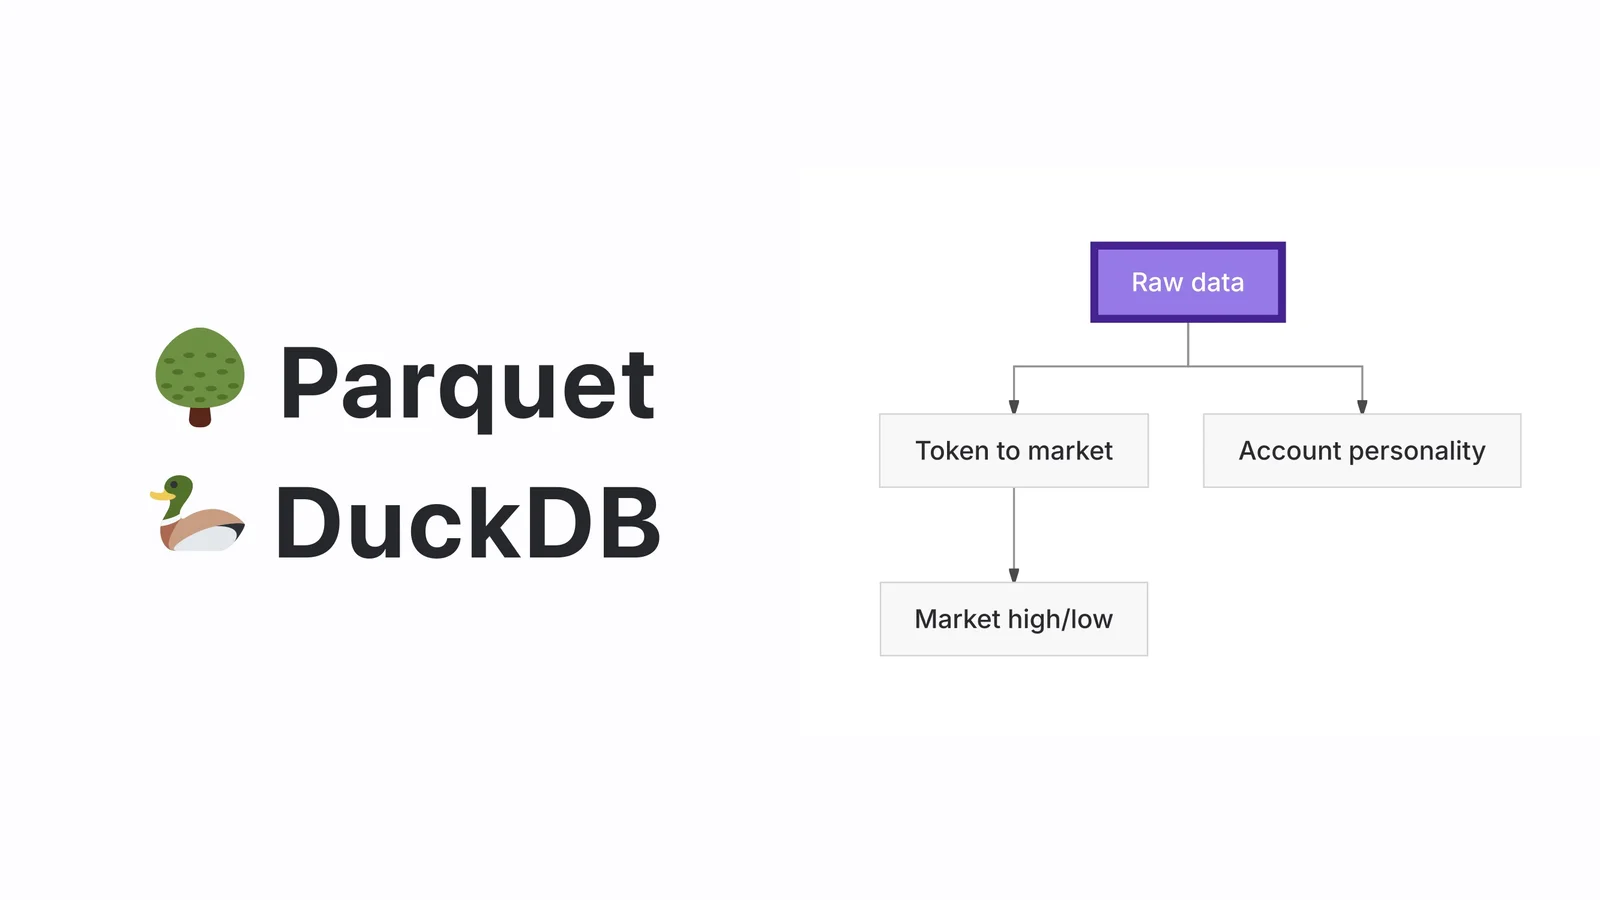
A good example is an account personality. For each account across the whole dataset you can compute how much money it made, how large its exposure ran, and how it spread trades across the 24 hours of the day. An account that trades every single hour is probably a bot, and instead of hand-waving you can say it precisely: its Shannon entropy across time is above five.
Other features connect a token back up to its parent market and superstructure, for instance every team in the World Cup carries its own yes/no token, and those are all related.
Those features feed concrete theses, we discussed a few at the talk:
Only a full-history backtest can separate the one meaningful anomaly from all the noise around it.
- Bands (ping-pong). Buy low and sell high across an oscillating range, leaning on technical indicators like moving averages, RSI, and crossovers. A wide band around your entry is a toll bridge you collect on each way; a narrow band that breaks against you hands you exposure you never wanted. (Optimize the band size!)
- Cross-market arbitrage. Compare the same or synthetic outcomes across venues like Kalshi and Polymarket. The danger is a mismatched resolution source, the same way some crypto firms got squeezed treating USDT and DAI as identical.
- Anomaly detection. Hunt for outsized, high-sigma bets. You hear on the news that someone connected to a war bet $50,000 the day before it started, but the news never shows you the thousands of $50,000 bets that meant nothing. (Model using ALL data, not just what is on TV.)
After you have created a hypothesis and have optimized some features, do a full backtest.
Backtesting, and the time-leak trap
The reason to backtest is simple: a robot cannot YOLO. A human can gamble on instinct, but an automated strategy has to be tested against as much history as you can throw at it. In this dataset that is a luxury, you can run a hypothesis against 100% of every trade ever made and get an answer in seconds. On NASDAQ you would be forced to sample a sliver of a few days out of petabytes.
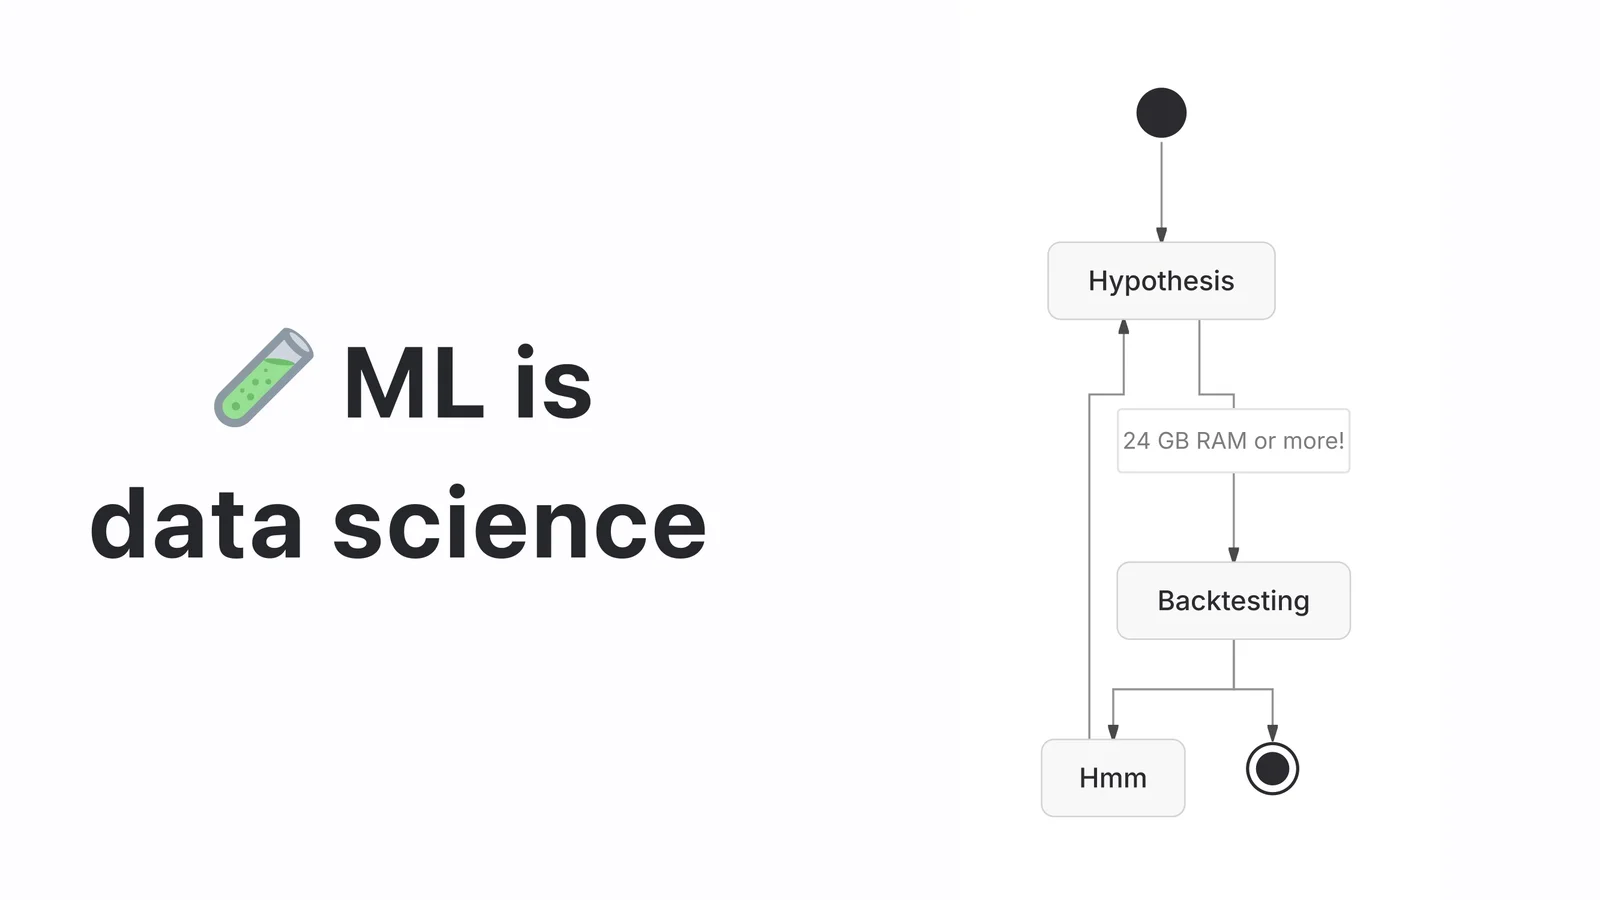
The single most dangerous mistake is a time leak. If you cannot timestamp a piece of information, get out.
If you have a roster or an injury report but you do not know exactly when it went public, your backtest will use knowledge that did not exist at the moment of the trade. It will see patterns that are not real, and lose money without understanding why.
Anything you can timestamp can be fed in directly. If you cannot get the exact time, you can sometimes estimate it from a reliable third-party schedule, but you have to be honest about which is which. Every run is also a git commit, because when a working strategy suddenly starts losing money the only way to do forensics is to reproduce the exact code and data behind each result. This is where LLMs shine: they are excellent at proposing the next variation, explaining why the last one failed, and keeping you in a fast hypothesize-test rhythm.
Trade operations
In production, a strategy is a state machine driven by triggers. It sits in a ready state collecting data, and nothing happens until several conditions line up at once: an external report drops, a price crosses a band, a watched account moves, an N-sigma event fires. Only when every required trigger is satisfied does it place a trade, and then it logs everything, what it believed, why it acted, and when the order cleared.
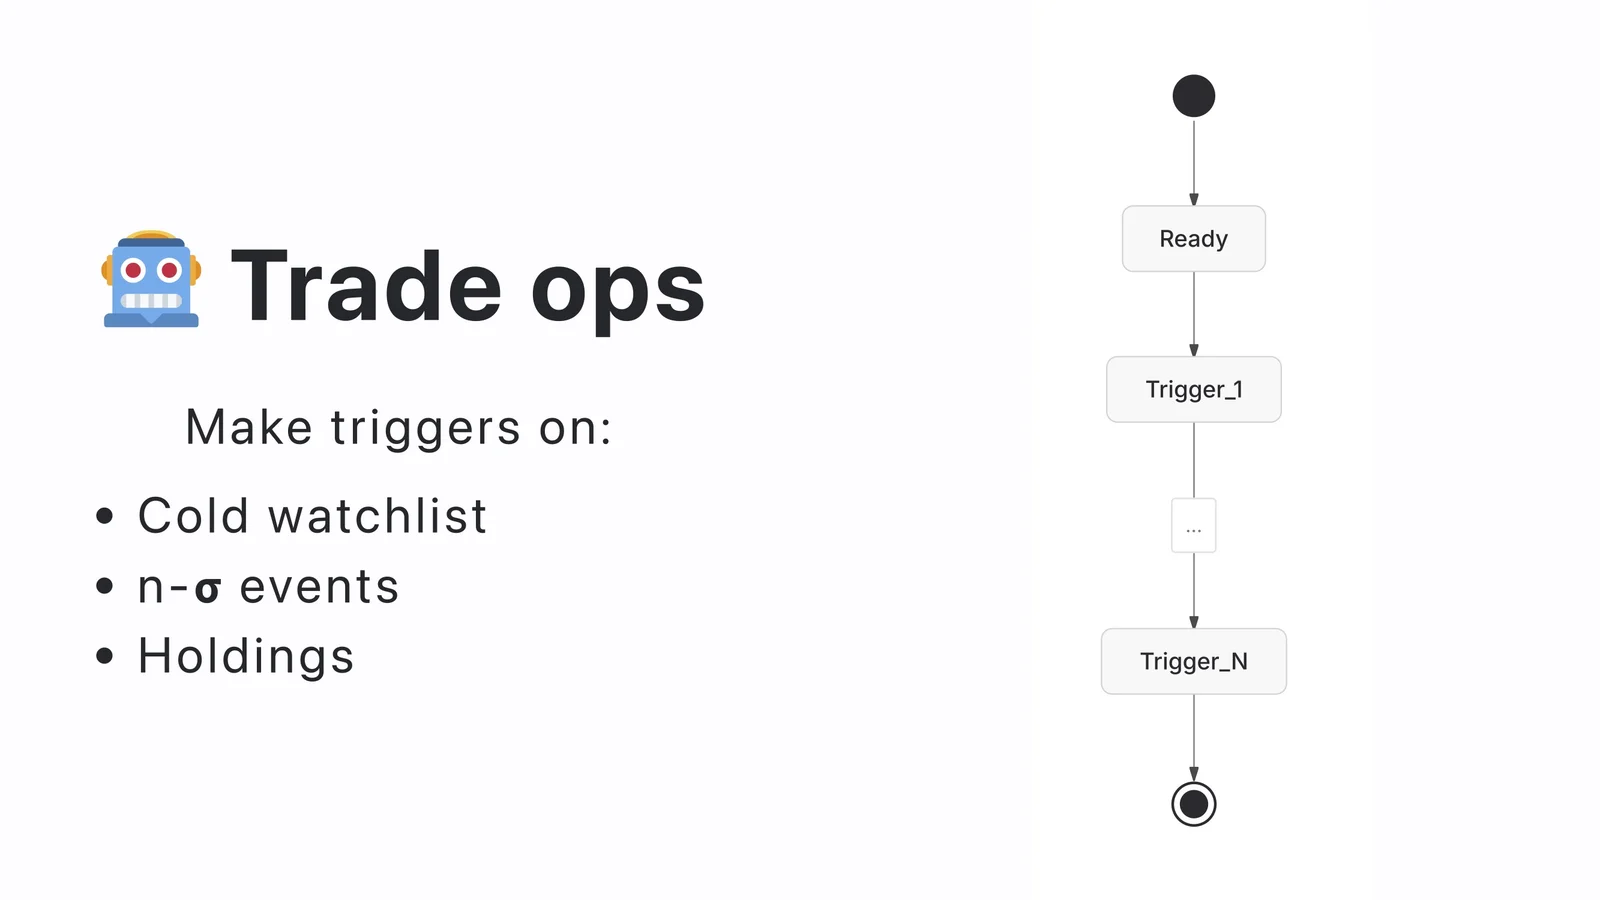
The first account strategy you should ever build is the boring one: sell everything I have. Being able to dump your whole position back to cash lets you reset risk and be ready to start the next trading round clean.
Execution is never instant. There is the two-second Polygon clearing time plus real network latency, so a band strategy may be reacting to data that is already a couple of seconds stale. On NASDAQ people fight over milliseconds and microseconds; here we fight over whole seconds. The failure mode is the same, you buy at a price far from where your signal fired, and when it happens you go back to the logged triggers and run the forensics. That is exactly why the logging has to be thorough.
Building it with an LLM
You may use LLM to help with your programming. I have collected some notes about my experience in using professional engineering techniques while getting LLM to do most of the work.
You don’t need to understand all of this discipline. But if you bark these buzzwords at your “junior assistant” then it will have a solid foundation for doing its work.
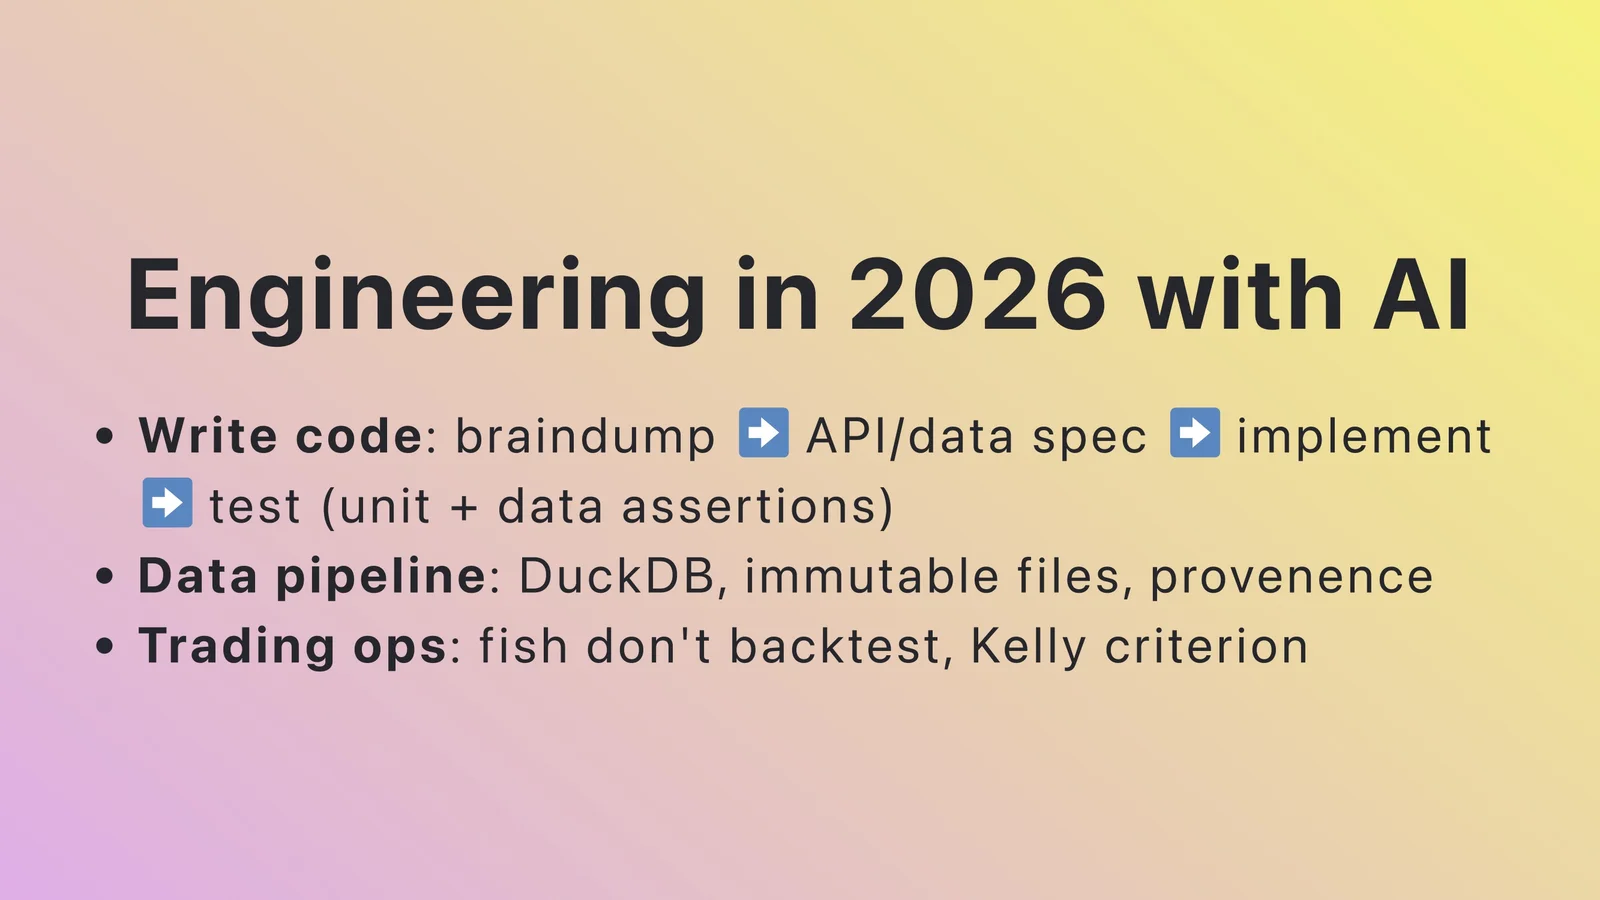
The first is the brain dump. Do not just tell the model “trade on rosters,” explain why you think rosters carry an edge, who will react to them, and which other markets they might move. Five minutes of talking through your reasoning is the most valuable five minutes in the project, because without it the model cannot actually help you.
Apps like this outgrow one-shot tools such as Claude Code or Grok. Past a certain size you have to think like an engineer again.
The second is the API (interface). For anything more complex than a throwaway toy, make the model write all the function signatures and none of the implementation first, then argue with itself about whether they are right, and stop so you can read them. That is where you catch the fatal omission, you never stored the time the roster arrived, before it burns days of runtime and hundreds of dollars of tokens on something that runs slowly and executes badly. Defining those contracts up front is just the SOLID principle applied to AI-generated code. Back it with two kinds of tests:
- unit tests for the code
- data tests to confirm the output is shaped the way the next stage expects
Finally, sizing. Once you have a strategy that genuinely works, the question is how much to bet, and the answer is the Kelly criterion. You do not need a finance degree, you just need the word, so you can hand it to the LLM instead of telling it to bet everything. Betting your whole bankroll each time guarantees ruin: one loss takes you to zero, and you can’t double your way back up from zero.
Fish don’t backtest
The closing line of the talk is “fish don’t backtest, so don’t be a fish.” The deeper point is that prediction markets are a rare place where one person can practice the entire modern data workflow end to end: source reproducible data, engineer features, form a hypothesis, backtest it honestly against full history and only then move to execution with real logging and risk control.
These skills could be worth far more than any money you’ll make with this trading bot. It transfers to any system that lives or dies on data, timing and reproducibility.
Next steps
If you are building your own data pipelines, hypotheses and backtest… then you might be a good candidate for a machine learning job. Send me your resume.
If you care about these topics and are hiring… then you might want good candidates. Send me your job posting.
I connect people and look forward to inviting you next time to a similar event, which always includes networking and mixers at the end!
▧
Comments
There are no comments yet.
Please discuss this topic anywhere and let me know any great comments or media coverage I should link here.